The greenhouses that outshine cities
In NASA Black Marble data for 2024 the greenhouses of Närpes shine 96 times brighter than the brightest point of Helsinki, and a complex near Yelets 228 times brighter than Lipetsk. We count how much light plants need, how little a winter window gives and how much a lamp adds.
The brightest point of Finland is not Helsinki
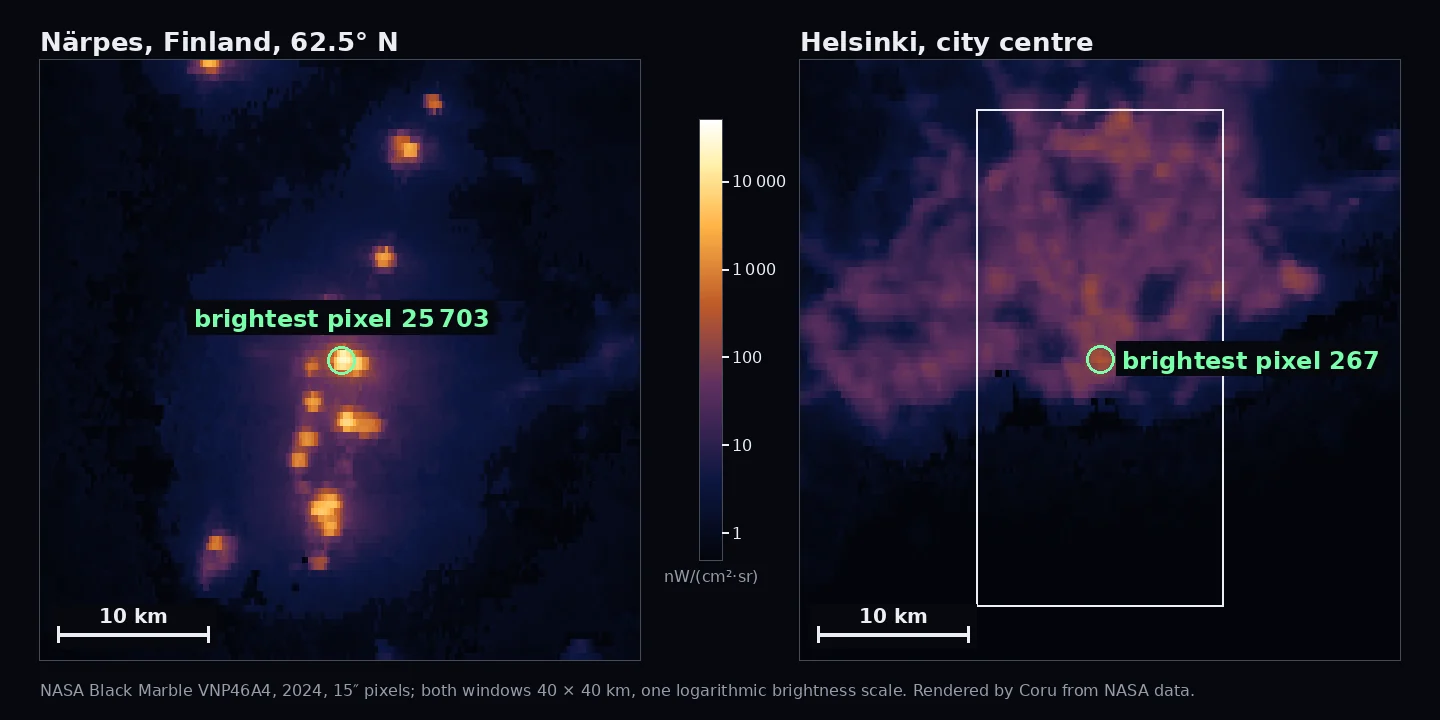
Look at Finland from space at night and the brightest place in the country is not the capital. It is tomatoes. In NASA's Black Marble yearly composite for 2024, the brightest pixel in a 40 × 40 km window around Närpes, a small town at 62.5° north, shines at 25,703 nW/(cm²·sr). The brightest pixel of central Helsinki: 267. Ninety-six times fainter.
The picture shows Närpes on the left and Helsinki on the right, at one scale and on one brightness scale. The city is an even violet smudge: its 15-arc-second pixels, roughly 460 × 210 m at this latitude, glow at a few dozen units. The greenhouses are a dozen orange dots, each hundreds of times brighter than the centre of the capital.
What is shining
Lamps. Närpes is Finland's greenhouse hub: it grows 60 per cent of the country's tomatoes and 35 per cent of its cucumbers, and the brightest pixel sits on the Siggpac greenhouse farm. In winter at the 62nd parallel that is impossible without lamps: sodium and LED fixtures hang above the rows, and at night the glass lets part of their light out into the sky; that escaping light is what the satellite sees.
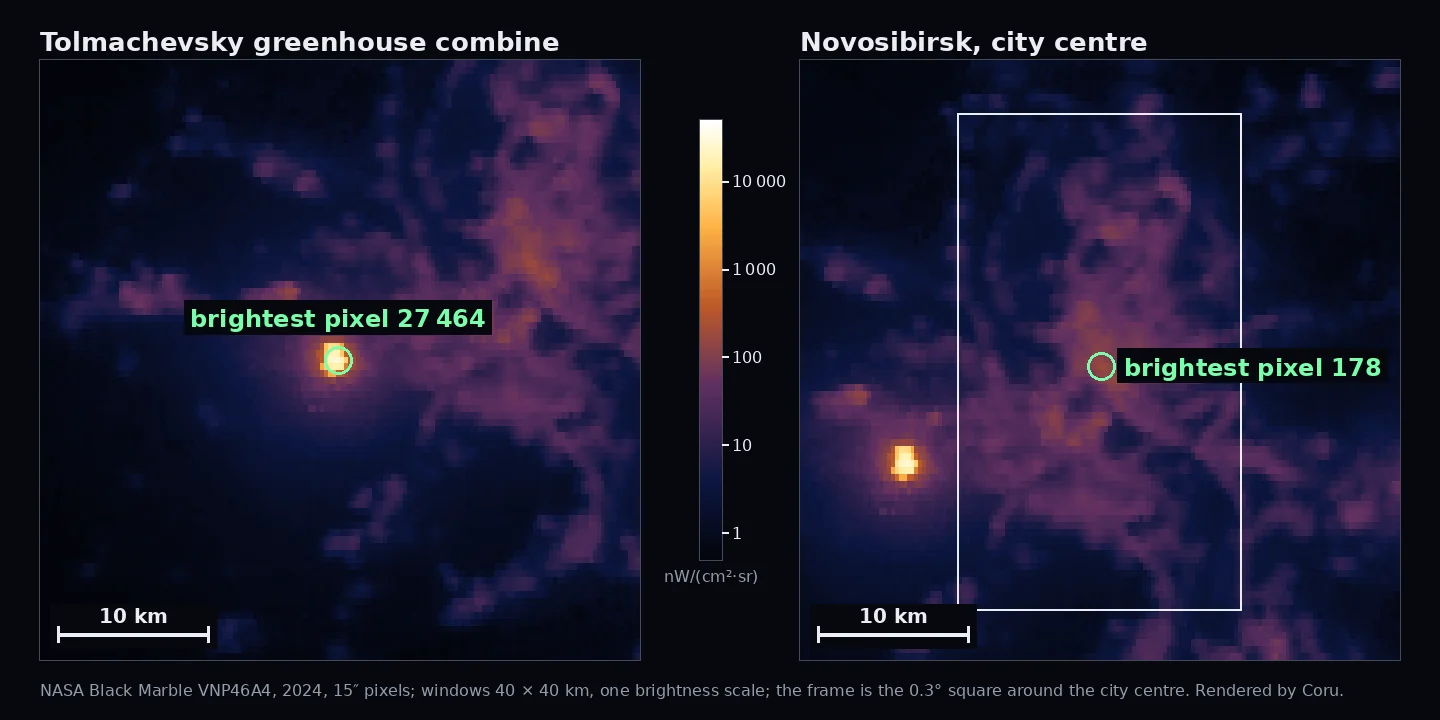
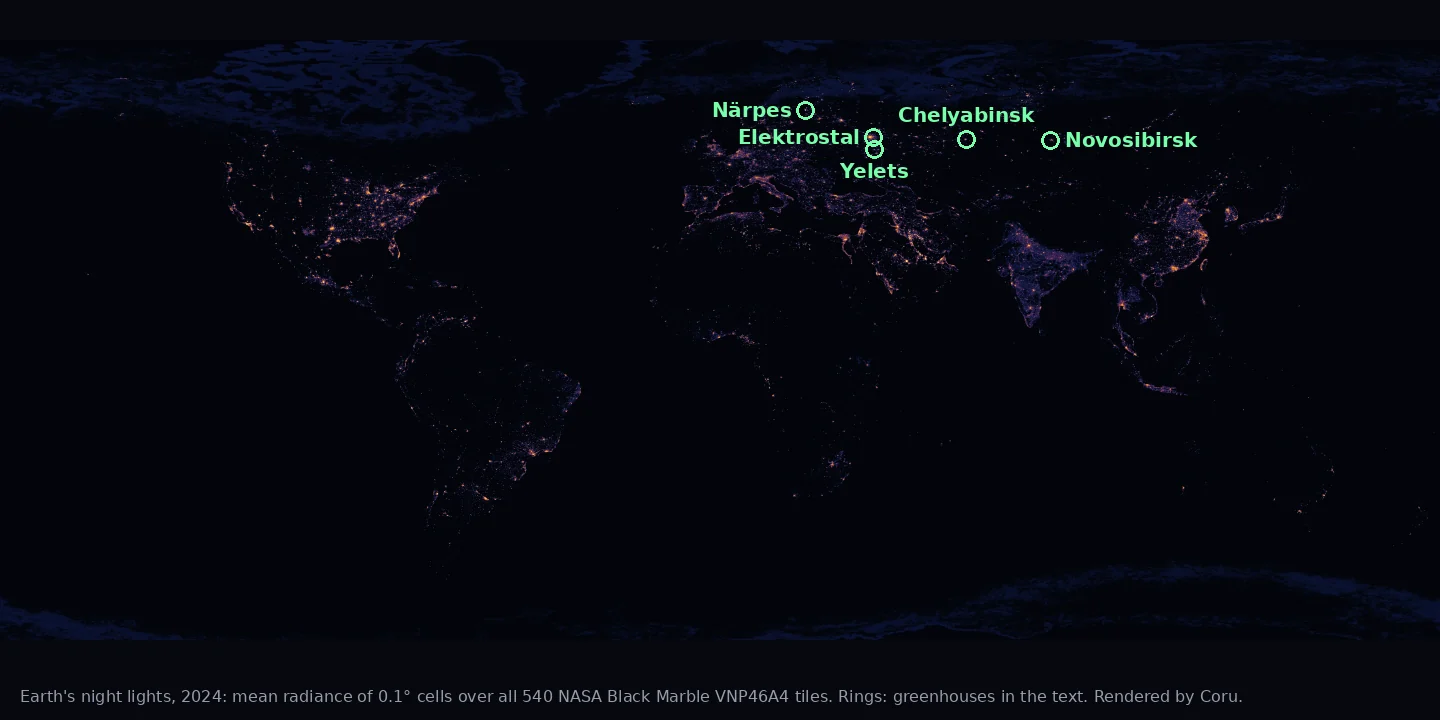
Russia has even more of these points. The brightest is a greenhouse complex south-east of Yelets, in Lipetsk oblast: 31,028 nW/(cm²·sr). The brightest pixel of Lipetsk is 136, a gap of 228 times. The Tolmachevsky greenhouse combine outside Novosibirsk gives 27,464 against 178 for the city's brightest pixel. Agrokompleks Ivanisovo on the edge of Elektrostal reaches 23,773, Agrokultura Group near Kashira 22,581, Churilovo in Chelyabinsk 22,327. Moscow's brightest pixel is 470, Saint Petersburg's 532. Residents of Elektrostal have complained that the glow from the greenhouses keeps them awake: the light bounces off the clouds into a huge yellow patch in the sky.
The only things brighter than greenhouses in this data are the gas flares of oil fields in Iraq, Venezuela and Iran, where pixels reach 48,454. The brightest cities on the planet do not even reach the greenhouses: the Las Vegas Strip 1,770, Manhattan 588, London 328, Paris 165.
How much light a plant needs
Light for a plant is counted not in lux but in moles of photons per square metre per day, the daily light integral, DLI. Purdue University's extension guide sorts crops into four classes: under 6 moles a day are low-light crops, 6 to 12 medium, 12 to 18 high and above 18 very high; most greenhouse growers provide a minimum of 10 to 12 moles during the finishing stage.
A fruiting tomato crop needs 30 moles a day or more, tomato seedlings 4.8 to 6, lettuce 12 to 13 moles. Below 3.1 moles a day tomatoes set fruit poorly, and in a single-truss experiment a positive yield began at 4 moles. Cornell's hydroponic lettuce system targets 17 moles a day, but without air blown over the leaves tipburn starts above 12.
Now take winter at the sixtieth parallel. In the NASA POWER climatology for 2001 to 2025, a square metre in Helsinki receives 0.53 MJ of solar radiation a day in December and 19.34 in June. Närpes gets 0.30 MJ in December, Moscow 1.27. Using the ratio in Dorais's review, where 1.5 MJ of solar radiation corresponds to 3.1 moles of photosynthetic light, a December day gives about 1.1 moles in Helsinki, 0.6 in Närpes and 2.6 in Moscow, while a June day gives about 40. A tomato needs nearly thirty times what December offers. That is why a Finnish winter tomato is lamps, and nothing but lamps.
Why a winter window is not a greenhouse
A window takes away even more. On the University of Illinois scale, right at a south window in the sun there are about 1,500 foot-candles; the "bright light" five feet from a south window or directly at an east or west one is 300, a north window gives 150, and three to ten feet from an east or west window 75. For sunlight one foot-candle is 0.2 µmol/(m²·s), so 300 foot-candles are 60 µmol/(m²·s). Keep that up for eight hours and the day adds up to 1.7 moles: less than seedlings need and seventeen times less than a fruiting tomato. Four hours of direct sun at a south window, 300 µmol/(m²·s), give 4.3 moles.
In a northern winter there are neither eight bright hours nor direct sun at the glass, and curtains, insect screens, trees outside and a dirty pane take another share. February seedlings on a windowsill live on fractions of a mole a day and cannot help stretching towards the glass: what they lack is not warmth but photons.
What a lamp gives
A lamp is simple arithmetic: intensity in µmol/(m²·s) times the seconds it runs, divided by a million. In Dorais's review, 100 µmol/(m²·s) for 16 hours adds 5.8 moles a day; tomato seedlings want 83 µmol/(m²·s) over 16 to 20 hours of light, which is exactly those 4.8 to 6 moles. Lettuce, in the Cornell handbook, wants 100 to 200 µmol/(m²·s) so that natural and lamp light together reach 17 moles. Measure at the leaves, not at the lamp: far less light reaches the leaves than leaves the fixture.
Light is not needed around the clock. Cucumber grows best with 18 to 20 hours of light, but older plants should be given 4 hours of darkness; for sweet pepper continuous light gave nothing over a 20-hour day; for tomato seedlings the review names 16 to 20 hours. A timer set to 16 hours is a sensible middle for a windowsill.
What to do with your own plants. Measure the light: a hand-held light meter accurate to one foot-candle will do, and one lux is roughly a tenth of a foot-candle. Move winter plants to a south window, no more than five feet from it, take the screen off and wash the glass. Give seedlings a lamp delivering 80 to 100 µmol/(m²·s) at the leaves for 16 hours, leafy greens 100 to 200. And do not expect a tomato from a February window: no lamp will bring a windowsill to 30 moles a day.
What the greenhouses burn
In a commercial greenhouse light is counted in watts per square metre. In Dorais's review the installed lighting capacity for tomato in Finland is about 160 W/m² with 400 W sodium lamps, for cucumber up to 200 W/m², and 100 µmol/(m²·s) is 20 W/m² of photosynthetic light. A hectare under such lamps draws 1.6 to 2 MW while they are on. In 2021 Finnish greenhouse enterprises used 619 GWh of electricity out of a total energy consumption of 1,706 GWh; "lighting is required in the production of vegetables in the winter", writes the Natural Resources Institute Finland, Luke, and names winter vegetable production, lighting and the price of electricity as the greatest threats to profitability.
Part of that light goes up into the sky, and that is what the satellite sees. In Ontario, where municipalities have restricted the night glow of greenhouses, research found that fully closed light abatement curtains cut light emissions by more than 99 per cent, and that the emission depends on the intensity of the supplemental light, on how far the curtains are closed and on how much vegetation the greenhouse holds; the curtains also roughly halve heat loss. Where the curtains are closed, the satellite has almost nothing to see. The orange dots in our pictures are lamps whose light nobody covered.
How the pictures were made
The data is NASA Black Marble VNP46A4 for 2024 (Collection 2), layer AllAngle_Composite_Snow_Free: a yearly snow-free composite of night-time radiance in 15-arc-second pixels, in nW/(cm²·sr). The 40 × 40 km windows are cut from the original pixels and shown at one scale; colour is the logarithm of radiance from 0.5 to 50,000, identical on both halves of each pair. The "brightest pixel of a city" is the maximum inside a 0.3° × 0.3° square around the centre. The world map shows the mean radiance of 0.1° cells on its own scale. The "brightest of all" ranking rests on all 540 tiles NASA publishes for 2024.
Data: NASA Black Marble VNP46A4 (Román et al. 2018), doi:10.5067/VIIRS/VNP46A4.002, NASA LAADS DAAC; solar radiation from NASA POWER. The pictures were rendered by Coru code from this data. NASA took no part in this page and does not endorse it.
Sources & further reading
- NASA Black Marble VNP46A4, Collection 2 (DOI)
- NASA LAADS DAAC, VNP46A4 product description
- NASA LAADS DAAC, data use and citation policies
- NASA POWER, solar radiation climatology (Helsinki)
- NASA POWER, solar radiation climatology (Närpes)
- NASA POWER, solar radiation climatology (Moscow)
- Torres & Lopez, Measuring Daily Light Integral in a Greenhouse, Purdue Extension HO-238-W
- Dorais, The use of supplemental lighting for vegetable crop production, Canadian Greenhouse Conference 2003
- Cornell CEA, Hydroponic Lettuce Handbook
- University of Illinois Extension, Houseplants: Lighting
- University of Maryland Extension, Lighting Indoor Plants
- UF/IFAS Gardening Solutions, Light for Houseplants
- Luke, The use of electricity increases and that of oil decreases in greenhouse production (2022)
- Ontario Ministry of Agriculture, Effect of greenhouse light abatement curtains